Sunday, 29 March 2015

Nifty - P&F analysis!!

Date: 29th March 2015

Nifty last closing price: 8341.40

Daily chart

Figure 1 is 10 box P&F chart plotted with daily closing prices. Chart and pattern remain bearish as explained during last week. Shorts should remain in unless close occur above 8530 being mid value of current column that will form Low Pole. Fresh shorts should wait for next signal. 8290 - 8310 are Anchor Point levels that are possible support levels from here. But this is not very important to know rather looking for supports in downtrend is a harmful practice. Sticking to technique is more rewarding. 
 
1 Min Chart

Figure 2 is 5 box P&F chart plotted with closing prices of every minute. Trend is bearish and various downside counts up to 8270 have been achieved by the price. Low pole formation occurred recently has activated upside count of 8500. Though upside counts in downtrend are not very reliable I think trade above 8375 will increase the probability of same getting achieved. Consolidating columns are likely scenario from here.   

Someone asked me about current formation of Relative strength chart of Bank Nifty that I shared earlier. Figure 3 is 0.25% P&F Relative strength chart of Bank Nifty to Nifty. Bank Nifty is underperforming Nifty as discussed then which was major reason of bearish view over medium term. As shown in the chart, ratio going below 2.13 will indicate further underperformance from Bank Nifty. 


Figure 1: Nifty daily 10 x 3 cl Point and Figure Chart


Figure 2: Nifty 1 min 5 x 3 cl Point and Figure Chart


Figure 3: Bank Nifty P&F Relative Strength Chart


 Prashant Shah, CMT, CFTe

 
Disclaimer:
All information provided above is for general information purposes only and does not constitute any investment advice. Company or Author shall not be liable for loss or damage that may arise from use of information provided above. The report is purely for information purposes and does not construe to be investment recommendation/advice or an offer or solicitation of an offer to buy/sell any securities. The readers of this material should take their own professional advice before acting on this information.


 

Sunday, 22 March 2015

Nifty P&F analysis: Give it time!!

Give it time!!
Date: 22nd March 2015
 
Nifty last closing price: 8570.90
 
 
Daily chart
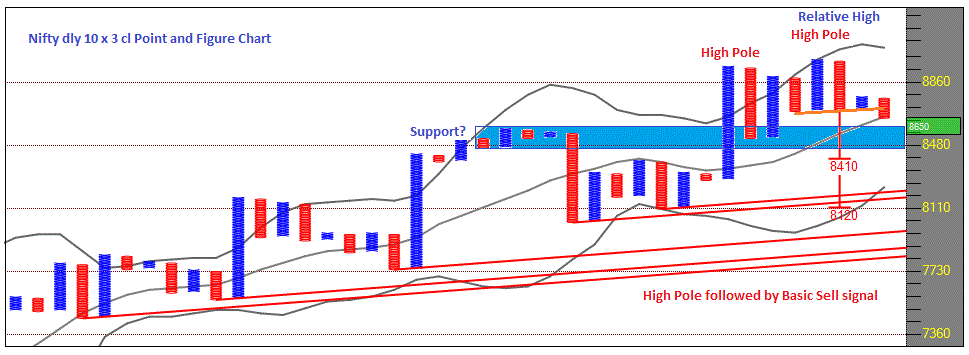
Figure 1 is 10 box P&F chart plotted with daily closing prices. Pattern is bearish at the moment being Double bottom sell continuation signal occurred after High Pole and Relative High. Bearish counts of 8410 and 8120 are active. As shown in the chart, price has come to 10 column lower Bollinger Band. A, B and C are instances shown in the chart of where price has taken support at lower band in this uptrend. Levels also coincide with the support placed at previous peak. It needs to be seen if price take support here though looking at the formation I doubt if it will make an important bottom here. Close above 8645 will form Low Pole and make chart neutral from bearish. Long signal will be triggered if price closes above 8730.   
 
 
1 Min Chart
Figure 2 is 5 box P&F chart plotted with closing prices of every minute. Bearish count of 8560 has been achieved.  Chart is bearish at the moment and lower counts are active. Recent price move within tight band that occurs at support area of higher degree chart indicate possibility of some sort of bounce. 8690 - 8720 are Anchor Point resistance area if price moves up from here. Trend and pattern at the moment are bearish.
 
Figure 1: Nifty daily 10 x 3 cl Point and Figure Chart


Figure 2: Nifty 1 min 5 x 3 cl Point and Figure Chart
 
 Prashant Shah, CMT, CFTe
 
Disclaimer:
All information provided above is for general information purposes only and does not constitute any investment advice. Company or Author shall not be liable for loss or damage that may arise from use of information provided above. The report is purely for information purposes and does not construe to be investment recommendation/advice or an offer or solicitation of an offer to buy/sell any securities. The readers of this material should take their own professional advice before acting on this information.

Sunday, 15 March 2015

Nifty P&F analysis: 'O' struck. Bearish counts activated!!

'O' struck. Bearish counts activated!!

Date: 15th March 2015

 
Nifty last closing price: 8647.75

Daily chart

Figure 1 is 10 box P&F chart plotted with daily closing prices. Price went below 8840 and setup turned bearish. It has generated bearish Double Bottom Sell pattern below 8690. It has occurred immediately after High pole formation hence a signal to trade short though price is still above bullish trend line. Bearish count of 8410 is active at the moment. It has also formed Relative High being sell signal formed below upper band after 'X'  going above it. Price closing above 8780 will turn it to bullish again and indicate SAR (Stop and Reverse) trade.

 
1 Min Chart

Figure 2 is 5 box P&F chart plotted with closing prices of every minute. Price immediately went below 8890 and came all the way to mark bearish box at 8635. Price is trading below bearish trend lines hence trend is down. Last pattern is quadruple bottom bearish pattern that has activated count of 8535. Two H&S kind of bearish horizontal patterns are marked in the chart that suggests counts around 8435. Chart is bearish unless the peak of second bearish pattern placed at 8830 is broken. 


Figure 1: Nifty daily 10 x 3 cl Point and Figure Chart


Figure 2: Nifty 1 min 5 x 3 cl Point and Figure Chart


 Prashant Shah, CMT, CFTe


Disclaimer:
All information provided above is for general information purposes only and does not constitute any investment advice. Company or Author shall not be liable for loss or damage that may arise from use of information provided above. The report is purely for information purposes and does not construe to be investment recommendation/advice or an offer or solicitation of an offer to buy/sell any securities. The readers of this material should take their own professional advice before acting on this information.


Sunday, 8 March 2015

Nifty P&F analysis:Trend up. Setup bullish unless below 8840!!

Trend up. Setup bullish unless below 8840!!

Date: 8th March 2015
 

Nifty last closing price: 8937.75
 

Daily chart

Figure 1 is 10 box P&F chart plotted with daily closing prices. Chart remain bullish as it is trading well above bullish trend line. Price has negated High pole bearish pattern which is a bullish event. Double top buy or close above 9000 will generate strong continuation signal. However, chart is bullish and position should remain long unless it closes below 8840 which will trigger another High Pole bearish reversal formation.
 

1 Min Chart

Figure 2 is 5 box P&F chart plotted with closing prices of every minute. Price is consolidating on this time frame at the moment. Triple Top buy signal formed recently near lower channel line and lower Bollinger band indicate possible upticks. But Anchor Point resistance is also playing role at current levels. Ticks above 8955 will confirm bullish setup and below 8890 will indicate some weakness. 


Figure 1: Nifty daily 10 x 3 cl Point and Figure Chart


Figure 2: Nifty 1 min 5 x 3 cl Point and Figure Chart


 Prashant Shah, CMT, CFTe

 
Disclaimer:
All information provided above is for general information purposes only and does not constitute any investment advice. Company or Author shall not be liable for loss or damage that may arise from use of information provided above. The report is purely for information purposes and does not construe to be investment recommendation/advice or an offer or solicitation of an offer to buy/sell any securities. The readers of this material should take their own professional advice before acting on this information.

Sunday, 1 March 2015

Nifty P&F analysis: 'X' everywhere!!

'X' everywhere!!
Date: 1st March 2015

 
Nifty last closing price: 8901.85

 
Daily chart

Figure 1 is 10 box P&F chart plotted with daily closing prices. As expected consolidation happened during last entire week. Discussed during last write up that close above 8900 will trigger buy signal. It has happened on Budget session of Saturday. Chart is bullish and pattern is bullish now as well. Setup to go long for positional traders.

 
1 Min Chart

Figure 2 is 5 box P&F chart plotted with closing prices of every minute. Resistance worked and price consolidated within a range during last week. It achieved lower side counts and now witnessing bullish breakout. Chart is bullish and counts till 9025 are active at the moment.
 
'X' is back on all time frames. Bulls to enjoy the ride!!


Figure 1: Nifty daily 10 x 3 cl Point and Figure Chart


Figure 2: Nifty 1 min 5 x 3 cl Point and Figure Chart


Figure 3: Bank Nifty Relative Strength Point and Figure Chart


 -  Prashant Shah, CMT, CFTe


Disclaimer:
All information provided above is for general information purposes only and does not constitute any investment advice. Company or Author shall not be liable for loss or damage that may arise from use of information provided above. The report is purely for information purposes and does not construe to be investment recommendation/advice or an offer or solicitation of an offer to buy/sell any securities. The readers of this material should take their own professional advice before acting on this information.