Nifty
P&F Analysis!!
Date: 22nd November 2015
Nifty last closing price: 7856.55
Daily chart
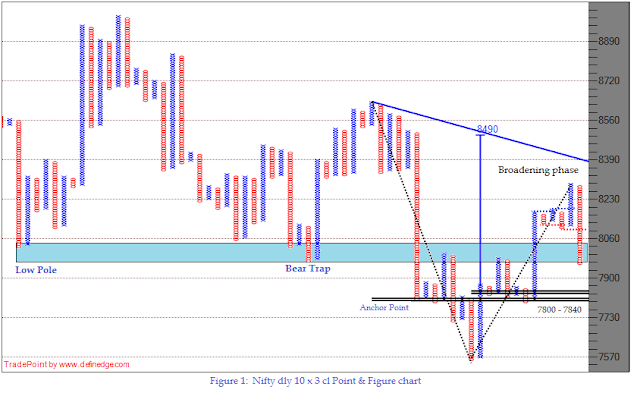
Figure 1 is 10
box P&F chart plotted with daily closing prices. The pattern is
bullish broadening formation occurred after bearish broadening formation which
is exactly opposite of the formation occurred before recent fall as shown in
the chart. Interestingly, these are rare formations. But it cannot be the
reason to expect similar kind of up move in the price. As discussed during last
week, price is expected to hover around 7800. Trend remain down but trading
setup is neutral.
Hourly Min Chart
Figure 2 is 10
box P&F chart plotted with hourly closing prices. Count and support level
of 7710 discussed during prior write ups worked well and price bounced back
from the same level. 7800 should work as support from here in short term as
well. Hovering around that level is expected but bearish pattern below that can
bring weakness and indicate that price may not be able to hold 7700. Supply
zone on the higher side is at 7970 - 8010.
Figure 3 is X-Percent
P&F Breadth indicator of Nifty 50. Indicator is at 42% hence at neutral
zone. Setup on this indicator shown during last post helped in identifying oversold zone and avoiding
fresh shorts.
In brief
Trend is down but trade
setup is neutral. Bearish pattern below 7800 would indicate that 7700 will not
be held. 7970 - 8010 is resistance zone on the higher side.
- Prashant Shah, CMT, CFTe
Disclaimer:
All information provided above is for general information purposes only and does not constitute any investment advice. The readers of this material should take their own professional advice before acting on this information.
All information provided above is for general information purposes only and does not constitute any investment advice. The readers of this material should take their own professional advice before acting on this information.


