Sunday, 18 August 2013

Trend is down. Love ‘O’s, Enjoy the screen!!

Trend is down. Love ‘O’s, Enjoy the screen!!
Date: 19th August 2013

People calling it a Black Friday!! It’s a trend day in terms of Market Profile. I believe no day can be brighter than such for trend followers.

Negative setup is been already discussed and also mentioned reasons for probable support area in the last week write up. Support was taken and downtrend is resumed. Control is regained by the established trend. As said earlier, buying at supports in downtrend can never be affordable and need more confirmations. Shorts that were covered above 5600 have got Fresh Double Bottom signal. Missing Double Bottom in downtrend is a sin.

Trend is down and more downside counts are being active. Figure 1 shows 45 degree trendline from significant bottoms along with anchor points. Price is trading near 45 degree support 
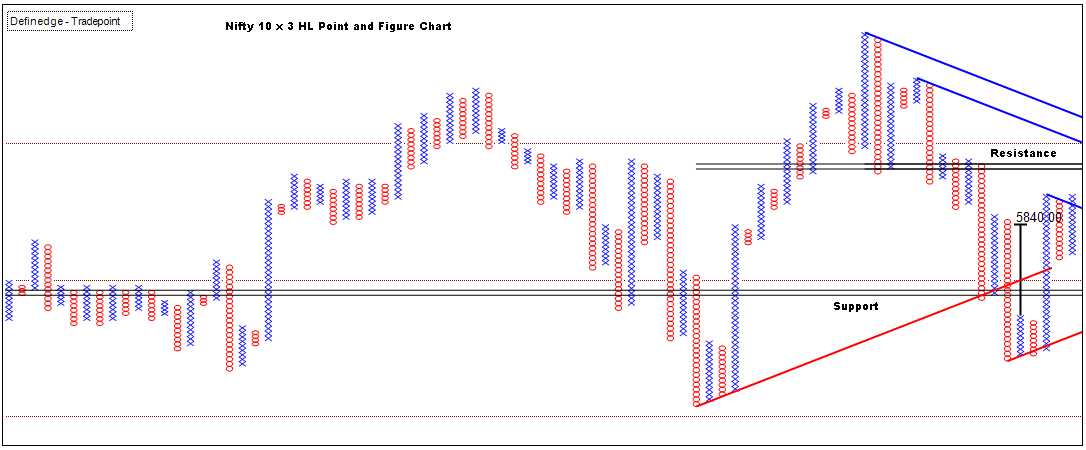
cluster. Figure 2 also suggests that price is trading near lower Bollinger band and anchor point. Nifty is trading near long term trend line in daily bar chart. But there are some evidences that any recovery will be short lived and some significant support zone lies near 5250 – 5300 levels. Fresh Double Bottom signal will confirm the long term trend line break hence should be taken. People must be looking at H&S pattern in bar charts or Three Buddha top in weekly candlestick charts.

But all this is about analysis which helps little in trading. Important information is that Trend is down and there are some signs of support which keeps forming. We traders keep crying for narrow ranges when price is consolidating and keep looking for supports and resistances for reversal when trend is established!  As said earlier also, P&F basic patterns can help in such situations. It’s a tool to react to the price behavior.

Multiple Vertical Counts that signals price direction below 5000 are active. 5680 – 5700 is an important resistance zone. Column of ‘O’ is active. Trade all formations of ‘O’ and all Double Bottom Sell signals with stoploss at subsequent Double Top Buy signals.

Figure 1: Nifty 10 x 3 CL Point and Figure Chart


Figure 2: Nifty 10 x 3 HL Point and Figure Chart


 -          - Prashant Shah

Disclaimer:
All information provided above is for general information purposes only and does not constitute any investment advice. Company or Author shall not be liable for loss or damage that may arise from use of information provided above. The report is purely for information purposes and does not construe to be investment recommendation/advice or an offer or solicitation of an offer to buy/sell any securities. The readers of this material should take their own professional advice before acting on this information.


Sunday, 11 August 2013

Trend down & talks of supports? Answer lies in basic P&F patterns!!

Trend down & talks of supports? Answer lies in basic P&F patterns!!
Date: 12th August 2013

Formation of column of ‘X’ during last trading session has ensured long 55 box column of ‘O’ in 10 box closing price Point & Figure chart of Nifty. This is longest column of O since Oct 2011. We have already discussed about negative setup and down side targets of Nifty. Current vertical fall has made price box touch 20 columns lower Bollinger Band in both the charts plotted with closing prices in Figure 1 and High low prices in Figure 2.

There are some evidences of support around current levels when we look at left. Along with trading near lower bands price is also trading near Anchor Points in both the charts and near previous highs which might act as support when price is falling. It is also trading near monthly trend line in Bar chart and several indicators are forming positive divergence in oversold zone in hourly charts!!

Hence trend is down but price is trading near support and there are chances of some relief rally.   Another important point is a possibility of formation of Bullish Low Pole in High low charts if price trades above 5600. Resistance area is around 5700 - 5720.

So should we go and Buy on Monday due to such indications and low risk reward?!! Risk reward of a trade against the established trend cannot ever be favorable and affordable! As said earlier also, one should avoid buying at first column of X in downtrend. And Double tops in downtrend need more confirmations.

In brief, cover existing shorts if price trades above 5600 due to Low pole formation. No fresh longs because setup is negative in closing price chart. Long Double Top signal if it occurs above 5600 but apply aggressive exits. Missing Double Bottom sell signal is a sin in such trends. Rather enjoy them with stop loss placed at subsequent Double Top Buy signal.


Figure 1: Nifty 10 x 3 CL Point and Figure Chart


Figure 2: Nifty 10 x 3 HL Point and Figure Chart


-         -  Prashant Shah


Disclaimer:
All information provided above is for general information purposes only and does not constitute any investment advice. Company or Author shall not be liable for loss or damage that may arise from use of information provided above. The report is purely for information purposes and does not construe to be investment recommendation/advice or an offer or solicitation of an offer to buy/sell any securities. The readers of this material should take their own professional advice before acting on this information.


Sunday, 4 August 2013

Vertical count cluster suggests Nifty to trade below 5000!!

Vertical count cluster suggests Nifty to trade below 5000!!
Date: 5th August 2013

We know that prices are falling and trend is down. Mentioned in last week write up that Double top buy signal is to be taken only above 5860. Coincidentally, High of corrective rally during last week was 5861. This can be seen in price-time charts only (bar, candles etc). Nifty continues to plot more Os with a fall of about 200 points during the week.

We have discussed about bearish set up in prices with Bear Trap and Relative high pattern formed near bearish objective trendline. Vertical count of 4860 is been activated in High Low chart during last week (Figure 3). I generally avoid taking count from such long column of Os but this column  is significant and  fulfilling all the conditions of taking a vertical count. I prefer going to 2 box chart when such long column vertical counts arise (Figure 4). Vertical counts from 2 box charts are short term counts but they often prove effective. Figure 5 shows 0.25% and 0.50%  3 box reversal charts to observe the activated counts and their levels. Figure 6 show charts with same box values plotted with 2 box reversals.. 3 box charts suggests counts direction below 5000 and 2 box charts are showing them near 5300.Count is established in chart with closing prices but not activated as yet due to consistent fall in prices without any reversal on closing basis.

Knowing about count direction can help us in designing the trading strategy. Figure 1 shows 10 box chart plotted with closing prices that has touched 20 column lower Bollinger band after formation of Relative High. Set up is bearish but near Anchor point support level and Internal objective line. Figure 2 is showing the larger degree pattern plotted with High Low prices to observe the important support levels. Anchor Point levels of different patterns are shown in the chart.

Fresh short doesn’t seem affordable unless column of reversal is formed. Trade formation of Os and all Double bottoms unless price goes above 5900. Trend can be trailed with 45 degree internals. We need low pole or Relative low to buy double tops and will write about if something like that is formed. I would never ask to buy first column of reversal unless low pole is formed.

For those who don’t understand much of P&F,Levels below 5000 are possible in future hence look for bearish set ups when price witness corrective rallies that doesn’t close above 5900.

 Figure 1: Nifty 10 x 3 CL Point and Figure Chart
 Figure 2: Nifty 10 x 3 HL Point and Figure Chart


Figure 3: Nifty 10 x 3 HL Point and Figure Chart

Figure 4: Nifty 10 x 2 HL Point and Figure Chart

Figure 5: Nifty 3 HL 3 Box Reversal Point and Figure Charts


Figure 6: Nifty 3 HL 2 Box Reversal Point and Figure Charts


 - -     Prashant Shah


Disclaimer:
All information provided above is for general information purposes only and does not constitute any investment advice. Company or Author shall not be liable for loss or damage that may arise from use of information provided above. The report is purely for information purposes and does not construe to be investment recommendation/advice or an offer or solicitation of an offer to buy/sell any securities. The readers of this material should take their own professional advice before acting on this information.


Sunday, 28 July 2013

Trade Fresh O from here. Double Top if above 5860!!
Date: 29th July 2013

Indicated possibility of a halt in uptrend in last week write up and the resistance area of 6060 – 6080 was mentioned. Looking left in P&F chart always help to find Support and Resistances. Nifty made high of around 6093 during last week and high box value of 6070 was marked in 10 box chart drawn with closing prices.

It is interesting to observe why I asked to leave longs below 5950. It has triggered Bull trap pattern near bearish objective line and that indicates near term weakness! The same can be observed in Figure 1 and 2 shown below. Unambiguous P&F patterns help in knowing about the pattern formation in real time or the level at which it will form! Occurrence will take care of time!

Short term downside vertical counts are activated in both the charts during last week. Larger degree trend seems forming some contracting pattern because both side internal lines are not breached and several counts are open in both the directions. I believe range expansion will happen but let price make us trade it.

Some support is visible between  5800 and 5840 on closing basis. But we have a setup worth not missing. First formation of O after Bull Trap near bearish objective trend line is an affordable set up especially for aggressive traders. Trade them with stoploss placed at high of that column. (30 points stoploss in 10 box chart). One might want to vary box size to manage risk.

And any double top Buy above 5860 must be taken because that will keep the price above bullish internal line. Stoploss to be placed on subsequent Double Bottom Sell signal.

Figure 3 is 1 box reversal chart of 0.25% Box value for observation. It helps in infusing some noise to P&F charts for analysing larger degree formations. Planning to start writing exclusively on 1 box charts.

Figure 1: Nifty 10 x 3 CL Point and Figure Chart
Figure 2: Nifty 10 x 3 HL Point and Figure Chart


Figure 3: Nifty 0.25% x 1 CL Point and Figure Chart


--          Prashant Shah


Disclaimer:
All information provided above is for general information purposes only and does not constitute any investment advice. Company or Author shall not be liable for loss or damage that may arise from use of information provided above. The report is purely for information purposes and does not construe to be investment recommendation/advice or an offer or solicitation of an offer to buy/sell any securities. The readers of this material should take their own professional advice before acting on this information.


Sunday, 21 July 2013

Leave Bulls below 5950!!
Date: 22nd July 2013

I asked in the last week write up to remain long unless Nifty goes below 5900. We saw the lows around 5910 and 5926 on Tuesday and Wednesday respectively but 5900 did not breach and new high of 6066 was made on Friday.  Buying at correctives and formation of Xs must have done well for traders.

As said earlier, set up is bullish. 6060 – 6080 seems the resistance area for a while and there are some signals that suggests a halt in current uptrend. But P&F gives us opportunity to form the rules that are objective and simple to take.

Ride the uptrend unless Nifty closes below 5950. Leave bulls if that happens. Some shorts with aggressive exit strategy can be taken if Nifty goes below 5920.

Figure 1: Nifty 10 x 3 CL Point and Figure Chart


 Figure 2: Nifty 10 x 3 HL Point and Figure Chart

-          - Prashant Shah


Disclaimer:
All information provided above is for general information purposes only and does not constitute any investment advice. Company or Author shall not be liable for loss or damage that may arise from use of information provided above. The report is purely for information purposes and does not construe to be investment recommendation/advice or an offer or solicitation of an offer to buy/sell any securities. The opinions expressed are current opinions as of the date appearing in the material and may be subject to change from time to time without notice. Investors should not solely rely on the information contained in this document and must make investment decisions based on their own investment objectives, risk profile and financial position. The readers of this material should take their own professional advice before acting on this information.


Sunday, 14 July 2013

Remain long unless below 5900!!

Remain long unless price goes below 5900!!
Date: 15th July 2013

Nifty witnessed price consolidation initially but broken out in the later part of the week. 5760 on the lower side was not breached to beat the 5900 on the higher side. Price set up is bullish with triangle breakout in closing price (Figure 1) and Triple Top breakout in High Low chart (Figure 2). Breakout has also activated vertical count of 6490.

Remain long unless price goes below 5900. Trade Double tops, correctives and Formation of Xs. 


Figure 1: Nifty 10 x 3 CL Point and Figure Chart

Figure 2: Nifty 10 x 3 HL Point and Figure Chart


-          - Prashant Shah


Disclaimer:
All information provided above is for general information purposes only and does not constitute any investment advice. Company or Author shall not be liable for loss or damage that may arise from use of information provided above. The report is purely for information purposes and does not construe to be investment recommendation/advice or an offer or solicitation of an offer to buy/sell any securities. The opinions expressed are current opinions as of the date appearing in the material and may be subject to change from time to time without notice. Investors should not solely rely on the information contained in this document and must make investment decisions based on their own investment objectives, risk profile and financial position. The readers of this material should take their own professional advice before acting on this information.


Sunday, 7 July 2013

Expect sideways, Shut the terminal if it trades below 5760!!

Expect sideways, Shut the terminal if it trades below 5760!!
Date: 8st July 2013

Nifty remained positive last week. Recommended to avoid shorts and buy correctives which has worked well. Nifty saw the bottom of 5760 to test 5900 again. Formation of X to P&F traders triggered a nice trade.

Significant anchor point suggests resistance at 5900. And that is not making longs affordable at the moment. Buy only if it goes above 5900 from here and apply aggressive exits.

I expect some price consolidation and sideways market during this week. Shut the terminals if it goes below 5760.


Figure 1: Nifty 10 x 3 CL Point and Figure Chart
Figure 2: Nifty 10 x 3 HL Point and Figure Chart


-          - Prashant Shah


Disclaimer:
All information provided above is for general information purposes only and does not constitute any investment advice. Company or Author shall not be liable for loss or damage that may arise from use of information provided above. The report is purely for information purposes and does not construe to be investment recommendation/advice or an offer or solicitation of an offer to buy/sell any securities. The opinions expressed are current opinions as of the date appearing in the material and may be subject to change from time to time without notice. Investors should not solely rely on the information contained in this document and must make investment decisions based on their own investment objectives, risk profile and financial position. The readers of this material should take their own professional advice before acting on this information.