Sunday, 14 June 2015

Nifty - Point & Figure analysis

Oversold!!

Date: 14th June 2015
 
Nifty last closing price: 7982.90

Daily chart (Medium - Intermediate trend)
 
Figure 1 is 10 box P&F chart plotted with daily closing prices.  


·         Last Pattern: Double bottom sell (Bearish)

·         Last Column: Bearish

·         45 degree trend: Bearish, At one 45 degree support line

·         Active count: 7630, 7480

·         Short exit level: 8130
 
 
8060 and 7930 both discussed during last week are achieved. More downside counts are open & price action in bearish. Bear trap will occur if price closes above 8130.
 

1 Min Chart (Short term trend)

Figure 2 is 5 box P&F chart plotted with closing prices of every minute. Lower counts up to 7900 are active. Chart is not bullish but Bear trap indicates support taken by price at 7945. Recovery is expected during coming week if these support levels are maintained.

Only 9 stocks from Nifty 50 are bullish on 1% box value at the moment. Bullish chart is where last signal is Double Top Buy signal. P&F breadth indicator 'Bullish percent' count the number of bullish and bearish stocks that provides clue for medium term trend. Reading below 20% is oversold zone. Current reading at 18% indicate that immediate downside is limited.

X-percent is another breadth indicator for short term trends. It calculates number of stocks where last column is 'X'. Current reading of this indicator is at 20% that suggests market is oversold even for shorter term.

This is not to call a bottom but to discuss the possibility of a meaningful bounce in short term. Certainly this cannot be traded unless price confirm.


Fig 1: Nifty dly 10 x 3 cl Point & Figure chart


Fig 1: Nifty1 min 5 x 3 cl Point & Figure chart


- Prashant Shah, CMT, CFTe


Disclaimer:
All information provided above is for general information purposes only and does not constitute any investment advice. The readers of this material should take their own professional advice before acting on this information. 
 

Sunday, 7 June 2015

Nifty P&F analysis

Date: 7th June 2015
 
Nifty last closing price: 8114.70
 
Daily chart (Medium - Intermediate trend)
 
Figure 1 is 10 box P&F chart plotted with daily closing prices.
 
·         Last Pattern: Double bottom sell after column consolidation (Bearish)
 
·         Last Column: Bearish
 
·         45 degree trend: Bearish
 
·         Active count: 8060, 7930
 
Price turned down with column 'O' that triggered long exit level of 8310. Follow up bullish signal did not occur above bullish 45 degree line and price again went below breakout line. Hence we need to look for bearish counts those are active. 8060 and 7930 are active counts from mini tops. Last box value is at 45 degree line support level. Fresh 'O' is required to active short trades from here.
 
 
1 Min Chart (Short term trend)
 
Figure 2 is 5 box P&F chart plotted with closing prices of every minute. As shown in the chart down trend from 8465 to 8100 was formed without even a mini top on such lower time frame. That was steep and strong downtrend. Treat for trend followers. Currently some base formation seems to be happening where both side counts are active. 8045 is active at the moment and 8285 will gain strength above 8170.   
 
Fig 1: Nifty dly 10 x 3 cl Point & Figure chart

Fig 2: Nifty 1 min 5 x 3 cl Point & Figure chart
 
            
- Prashant Shah, CMT, CFTe
 
 
Disclaimer:
All information provided above is for general information purposes only and does not constitute any investment advice. The readers of this material should take their own professional advice before acting on this information.

Sunday, 31 May 2015

Nifty P&F analysis: Status quo, reversal level trailed up!!

Status quo, reversal level trailed up!!
Date: 31st May 2015

 
Nifty last closing price: 8433.65

 
Daily chart (Medium - Intermediate trend)

 
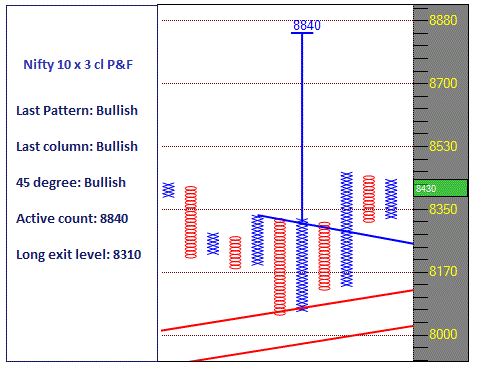
Figure 1 is 10 box P&F chart plotted with daily closing prices.
 

·         Last Pattern: Column consolidation after bullish patterns (Bullish)

 
·         45 degree trend: Bullish

 
·         Active count: 8840

 
·         Long exit level: 8310     

 
These levels will change with every formation of X or O.
 

1 Min Chart (Short term trend)

Figure 2 is 5 box P&F chart plotted with closing prices of every minute. Resistance and support levels shown last week has worked well. Price respected both the levels. I always feel that Anchor point is most underused tool of P&F world.

 It's a status quo. Formation remain bullish and only development of the week is that reversal level trailed up for long exits.


Fig 1: Nifty dly 10 x 3 cl Point & Figure Chart


Fig 2: Nifty 1 min 5 x 3 cl Point & Figure Chart


Fig 3: Nifty dly 10 x 3 cl Point & Figure Chart


- Prashant Shah, CMT, CFTe


Disclaimer:
All information provided above is for general information purposes only and does not constitute any investment advice. The readers of this material should take their own professional advice before acting on this information.

Saturday, 23 May 2015

Nifty Point & Figure analysis: 8840 activated!!

8840 activated!!
Date: 24th May 2015

Nifty last closing price: 8458.95

 
Daily chart (Medium - Intermediate trend)


Figure 1 is 10 box P&F chart plotted with daily closing prices.

 
·         Last Pattern: Triangle breakout, Double top buy after Low Pole, Variation of Bear trap, Mini top negated (All bullish)

·         45 degree trend: Bullish

·         Active count: 8840

·         Long exit level: 8290 (High pole level)

·         Short entry level: 8120

These levels will change with every formation of X or O. Long entry level will be trailed up with every formation of X. Double bottom sell signal below trend line occurring above 8120 will become short entry level.

 
1 Min Chart (Short term trend) 

Figure 2 is 5 box P&F chart plotted with closing prices of every minute.

Discussed triple top buy signal above 8275. Last week run has been very smooth with the help of 45 degree trend lines. Chart is bullish though some resistance seen around current levels. Supply can drag it down a bit but this was a third  attempt of anchor point breakout hence I expect previous resistance to act as support. Remain bullish till it maintains 8290 levels.

Mentioned that trade is coming. Basic signals are guide:)


Figure 1: Nifty dly 10 x 3 cl Point & Figure chart

Figure 2: Nifty 1 min 5 x 3 cl Point & Figure chart


 Prashant Shah, CMT, CFTe


Disclaimer:
All information provided above is for general information purposes only and does not constitute any investment advice. The readers of this material should take their own professional advice before acting on this information.

Sunday, 17 May 2015

Nifty Point & Figure analysis: Triangle at Anchor Points!!

Triangle at Anchor Points!!

Date: 17th May 2015


Nifty last closing price: 8262.35

 
Daily chart (Medium - Intermediate trend)

Figure 1 is 10 box P&F chart plotted with daily closing prices. Nifty observed strong supply and turned down exactly from 8330 level of Mini-top discussed in the last post. Mentioned that charts are neutral and I expect column consolidation which is what actually happening. Figure 2 shows that there is no trade signal in last 3 columns. They remain neutral at the moment with triangle formation in making. It will generate buy signal above 8330 and sell signal below 8120. Positive breakout in current column of 'X' will also form of Double top buy after Low pole that will open much higher counts. Trend is down being below 45 degree trend line and active lower count of 7930.

 
Basic signal after such kind of consolidating columns are worth taking. My observation is also that first breakout after such columns often prove false or witness sharp pullback. But idea is to follow every basic signal after breakout which should eventually give us directional move in favor. Chances of failure of first attempt are increased if more time is spent in the range (column consolidation) and when columns are wide.  

 
1 Min Chart (Short term trend)

Figure 3 is 5 box P&F chart plotted with closing prices of every minute. Trend is up on this time frame with open counts up to 8330. Trade above 8275 will trigger triple top buy.

Figure 4 and 5 are showing Anchor Points on daily and 1 min charts respectively.

Period on daily chart is of last one year for Anchor point. It is drawn from current top of 8830 on lower time frame. Anchor points are basically price levels where maximum activity is seen in that period. Both time frame Anchor points are around current levels where price has seen strong supply pushing back the prices. Breakouts will be interesting.

Trade is coming.. basic signals are tools!!


Fig 1: Nifty dly 10 x 3 cl Point & Figure chart


Fig 2: Nifty dly 10 x 3 cl Point & Figure chart


Fig 3: Nifty 1 min 5 x 3 cl Point & Figure chart


Fig 4: Nifty dly 10 x 3 cl Point & Figure chart


Fig 5: Nifty 1 min 5 x 3 cl Point & Figure chart
 

 Prashant Shah, CMT, CFTe


Disclaimer:
All information provided above is for general information purposes only and does not constitute any investment advice. Company or Author shall not be liable for loss or damage that may arise from use of information provided above. The report is purely for information purposes and does not construe to be investment recommendation/advice or an offer or solicitation of an offer to buy/sell any securities. The readers of this material should take their own professional advice before acting on this information.

Sunday, 10 May 2015

Nifty Point & Figure analysis: Mini top at 8330!!

Mini Top at 8330!!
Date: 10th May 2015

Nifty last closing price: 8191.50


Daily chart (Medium - Intermediate trend)

Figure 1 is 10 box P&F chart plotted with daily closing prices. Reversal level of 8290 got triggered earlier during the week. And price turned down again by going below 8180 that generated fresh double bottom sell signal. The formation (Immediate sell signal) has marked Mini Top at 8330 which is trailed down from 8830. Chart will not turn bullish unless price closes above this level. Low pole formation at last column has called for exits to short trades hence trade signal is neutral at the moment. I expect column consolidation from here. Close above 8330 will also generate bullish engulfing formation that calls for long with stop placed at column reversal.


1 Min Chart (Short term trend)

Figure 2 is 5 box P&F chart plotted with closing prices of every minute. 8315 count discussed during last week got achieved immediately to my surprise. But trend resumed downtrend then and achieved all counts activated from Mini-tops as shown in the chart. Friday bullish engulfing column from box value 8000 marked the bottom and activated 8225. Trend has turned up on this time frame. Anchor point resistance is 8270 - 8280 levels and support is placed around 8070.

Interestingly, I saw only 4 charts were bullish among Nifty 50 on last Thursday on 1% box value. Bullish percent is P&F breadth indicator which calculates ratio of bullish P&F stocks in an index. Extreme levels are used for contrarian approach. 8% (4 from 50) indicates trend exhaustion. I am working on back dated entries and soon will present the historical Bullish percent chart of Nifty.

Fig 1: Nifty dly 10 x 3 cl Point & Figure chart

Fig 2: Nifty 1 min 5 x 3 cl Point & Figure chart


 -  Prashant Shah, CMT, CFTe


Disclaimer:
All information provided above is for general information purposes only and does not constitute any investment advice. Company or Author shall not be liable for loss or damage that may arise from use of information provided above. The report is purely for information purposes and does not construe to be investment recommendation/advice or an offer or solicitation of an offer to buy/sell any securities. The readers of this material should take their own professional advice before acting on this information.
Sunday, 3 May 2015

Nifty - Point & Figure analysis

Nifty - P&F analysis!!

Date: 3rd May 2015

 
Nifty last closing price: 8181.50

 
Daily chart (Medium - Intermediate trend)

Figure 1 is 10 box P&F chart plotted with daily closing prices. Negative setup discussed during last week witnessed follow through with continuous double bottom sell pattern. Exit level is trailed further and placed at 8290 on closing basis at the moment.

1 Min Chart (Short term trend)

Figure 2 is 5 box P&F chart plotted with closing prices of every minute. Trend is down at the moment but trade above 8210 will activate short term counts of 8270 and 8315.


Figure 1: Nifty daily 10 x 3 cl Point and Figure Chart


Figure 2: Nifty dly 10 x 3 cl Point and Figure Chart


 Prashant Shah, CMT, CFTe

 
Disclaimer:
All information provided above is for general information purposes only and does not constitute any investment advice. Company or Author shall not be liable for loss or damage that may arise from use of information provided above. The report is purely for information purposes and does not construe to be investment recommendation/advice or an offer or solicitation of an offer to buy/sell any securities. The readers of this material should take their own professional advice before acting on this information.