Sell at column
reversal! 5900 important level!
Date: 7th October
2013
Price declined earlier during
the week and rallied latter. The reversal or column of ‘X’ was discussed in
last week write up. Given resistance levels are seen on Friday.
But as said, I don’t know
if price will respect this resistance zone or it has something else in store. Let
the column reverse to know the resistance level.
Charts and analysis:
Figure 1 is 10 box chart
plotted with closing prices and 6% bands of 10 day SMA. Price has rejected the
upper band and trading near significant resistance. Figure 2 is chart plotted with high - low
prices and shows anchor point levels in Nifty. Recent high and low box values
are exactly between those anchor point bands. Breakout or rejection needs confirmation
by formation of basic P&F patterns.
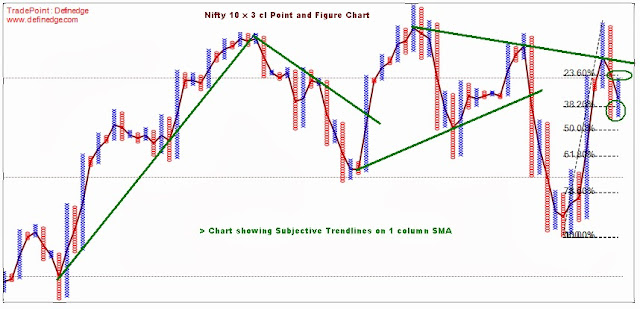
Notice the figure 3. It
displays subjective trend lines on 1 column SMA on 10 box chart plotted with
closing prices. 1 period average is simply a midpoint level of every column.
Such trend line analysis helps in removing the noise and analysing a trend of
column reversal. Chart also shows the Fib retracement levels.
Downside counts are dominating
and trend is down. This downtrend gets negated if price trades above bearish
resistance objective line. A breakout (Double
top buy) signal above 5900 will confirm this breach and negate the downtrend. Hence
the 5900 level on closing basis is important and strategy needs to be formed
around that level.
P&F strategy for next week:
Go short at first formation of ‘O’
from here with stoploss placed at Double top buy signal. This would be a trade
with tight stoploss. Apply aggressive exit (column reversal) if that reversal
is above 5900. Double top buy signal above 5900 is a breakout above bullish
support line hence should be taken.
In simple words, Set up is still
negative but sustenance or breakout above 5900 levels will make downtrend weak.
Breakout in P&F charting is simple Double top buy and Double bottom sell
signal.
 | |
|
 |
| Figure 2: Nifty 10 x 3 HL Point and Figure Chart |
 |
Figure 3: Nifty 10 x 3 CL Point and Figure Chart
|
- Prashant Shah, CMT, CFTe
Disclaimer:
All information provided above is for general
information purposes only and does not constitute any investment advice.
Company or Author shall not be liable for loss or damage that may arise from
use of information provided above. The report is purely for information
purposes and does not construe to be investment recommendation/advice or an
offer or solicitation of an offer to buy/sell any securities. The readers of
this material should take their own professional advice before acting on this
information.
No comments:
Post a Comment