Trade Fresh
O from here. Double Top if above 5860!!
Date: 29th July 2013
Date: 29th July 2013
Indicated
possibility of a halt in uptrend in last week write up and the resistance area
of 6060 – 6080 was mentioned. Looking left in P&F chart always help to find
Support and Resistances. Nifty made high of around 6093 during last week and
high box value of 6070 was marked in 10 box chart drawn with closing prices.
It
is interesting to observe why I asked to leave longs below 5950. It has
triggered Bull trap pattern near bearish objective line and that indicates near
term weakness! The same can be observed in Figure 1 and 2 shown below. Unambiguous P&F patterns help in knowing about the pattern formation in real time or
the level at which it will form! Occurrence will take care of time!
Short
term downside vertical counts are activated in both the charts during last week.
Larger degree trend seems forming some contracting pattern because both side
internal lines are not breached and several counts are open in both the
directions. I believe range expansion will happen but let price make us trade
it.
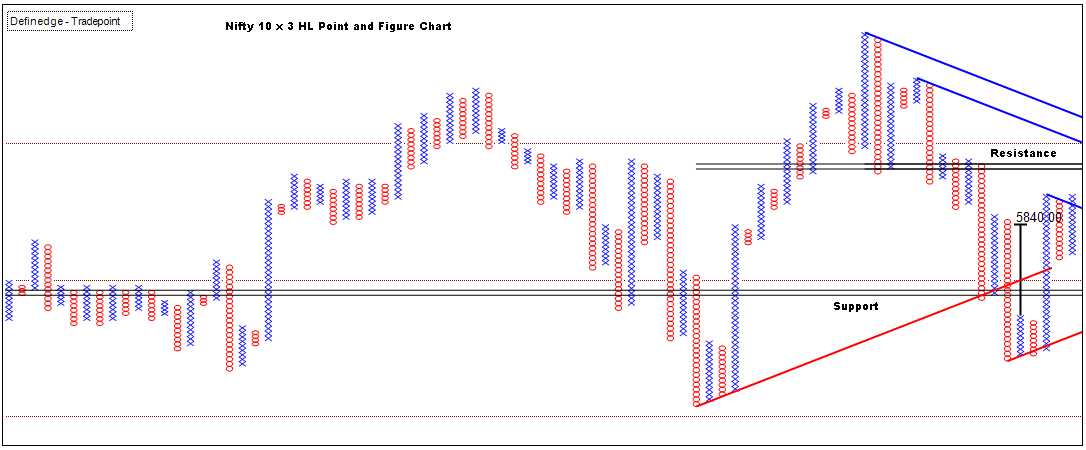
Some
support is visible between 5800 and 5840
on closing basis. But we have a setup worth not missing. First formation of O after Bull Trap near bearish objective trend
line is an affordable set up especially for aggressive traders. Trade them with stoploss placed at high of
that column. (30 points stoploss in 10 box chart). One might want to vary
box size to manage risk.
And
any double top Buy above 5860 must be
taken because that will keep the price above bullish internal line.
Stoploss to be placed on subsequent Double Bottom Sell signal.
Figure
3 is 1 box reversal chart of 0.25% Box value for observation. It helps in
infusing some noise to P&F charts for analysing larger degree formations. Planning
to start writing exclusively on 1 box charts.
 |
| Figure 1: Nifty 10 x 3 CL Point and Figure Chart |
 |
| Figure 2: Nifty 10 x 3 HL Point and Figure Chart |
 |
| Figure 3: Nifty 0.25% x 1 CL Point and Figure Chart |
--
Prashant
Shah
Disclaimer:
All information provided above is for general information purposes only and does not constitute any investment advice. Company or Author shall not be liable for loss or damage that may arise from use of information provided above. The report is purely for information purposes and does not construe to be investment recommendation/advice or an offer or solicitation of an offer to buy/sell any securities. The readers of this material should take their own professional advice before acting on this information.
All information provided above is for general information purposes only and does not constitute any investment advice. Company or Author shall not be liable for loss or damage that may arise from use of information provided above. The report is purely for information purposes and does not construe to be investment recommendation/advice or an offer or solicitation of an offer to buy/sell any securities. The readers of this material should take their own professional advice before acting on this information.


