Status
quo, reversal level trailed up!!
Date: 31st May 2015
It's a status
quo. Formation remain bullish and only development of the week is that reversal
level trailed up for long exits.
Disclaimer:
All information provided above is for general information purposes only and does not constitute any investment advice. The readers of this material should take their own professional advice before acting on this information.
Date: 31st May 2015
Nifty last closing price: 8433.65
Daily
chart (Medium - Intermediate trend)
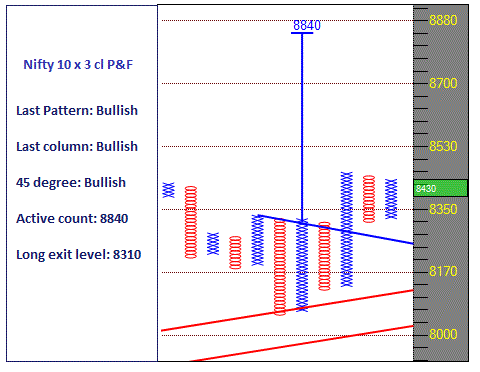
Figure
1 is 10 box P&F chart plotted with daily closing
prices.
·
Last
Pattern: Column consolidation after bullish patterns (Bullish)
·
45
degree trend: Bullish
·
Active
count: 8840
·
Long
exit level: 8310
These
levels will change with every formation of X or O.
1
Min Chart (Short term trend)
Figure
2 is 5 box P&F chart plotted with closing prices of every
minute. Resistance and support levels shown last week has worked well. Price
respected both the levels. I always feel that Anchor point is most underused
tool of P&F world.
 |
| Fig 1: Nifty dly 10 x 3 cl Point & Figure Chart |
 |
| Fig 2: Nifty 1 min 5 x 3 cl Point & Figure Chart |
 |
| Fig 3: Nifty dly 10 x 3 cl Point & Figure Chart |
- Prashant Shah, CMT, CFTe
All information provided above is for general information purposes only and does not constitute any investment advice. The readers of this material should take their own professional advice before acting on this information.


.gif)
.gif)
Fig%2B1.gif)
Fig%2B2.gif)