Sunday 13 December 2015

Nifty Point & Figure analysis

Nifty P&F Analysis!!
Date: 11th December 2015

Nifty last closing price: 7610.45

Daily chart

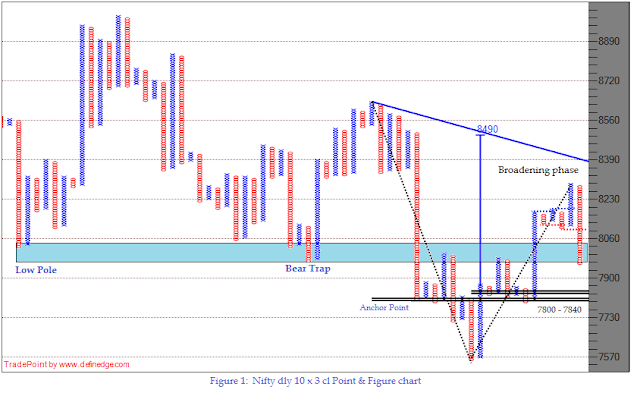
Figure 1 is 10 box P&F chart plotted with daily closing prices. Current formation has got multiple bearish patterns in the same setup. consecutive bearish broadening formations, High Pole, Bull trap and Double Bottom sell are formed in the same column hence overall structure remain bearish. But close above 7690 is exit level for short trades being a level for Double top buy signal. 7600 is Anchor point of Nifty when plotted after significant breakout of 6300. Hence it can remain important reference point for short and medium term traders.


Hourly Min Chart

Figure 2 is 10 box P&F chart plotted with hourly closing prices. Stated earlier that bearish formation below 7800 will be the first indication that bottom of 7700 may not be held. It quickly made new swing low once 7800 was breached. Prior low of 7540 is a significant reference point and every trader must be looking at it.  7680 and 7830 are the reference levels on the higher side.

Figure 3 is X-Percent P&F Breadth indicator of Nifty 50. Indicator is at 12% at the moment that shows that 44 stocks among 50 are in column of 'O' (downtrend) on 1% box value. It is at oversold zone hence at least some consolidation is expected.

In brief

Trend & momentum is down but market is in oversold zone. Close above 7690 is an exit level for medium term short trades. 7540, 7410 are reference levels on the lower side whereas 7680 and 7830 are the key levels on the higher side.


- Prashant Shah, CMT, CFTe


Disclaimer:
All information provided above is for general information purposes only and does not constitute any investment advice. The readers of this material should take their own professional advice before acting on this information.

Sunday 6 December 2015

Nifty Point & Figure Analysis

Nifty P&F Analysis!!
Date: 6th December 2015

Nifty last closing price: 7781.90

Daily chart

Figure 1 is 10 box P&F chart plotted with daily closing prices. Current pattern is high pole followed after broadening formation as shown in the chart. Trend is horizontal and setup remain neutral. 7800 is anchor point of entire base pattern. Bearish pattern below the same will open multiple counts on the lower side.


Hourly Min Chart

Figure 2 is 10 box P&F chart plotted with hourly closing prices. 7650-7700 can easily be identified as demand zone as multiple bottoms can be seen in current setup around same levels. 7800 is Anchor point that can be seen on hourly chart as well being wide horizontal setup. Bearish pattern below the same will be earlier indication that bottom of 7700 may not remain protected. Higher counts of more than 8070 are open and will get strength if bullish pattern is occurred above 7800.

Figure 3 is X-Percent P&F Breadth indicator of Nifty 50. Indicator is at 44% hence at neutral zone.

In brief

Trend is horizontal and setups are neutral as of now. 7800 is important reference level.


- Prashant Shah, CMT, CFTe


Disclaimer:
All information provided above is for general information purposes only and does not constitute any investment advice. The readers of this material should take their own professional advice before acting on this information.

Sunday 22 November 2015

Nifty Point & Figure analysis!!

Nifty P&F Analysis!!
Date: 22nd November 2015

Nifty last closing price: 7856.55

Daily chart

Figure 1 is 10 box P&F chart plotted with daily closing prices. The pattern is bullish broadening formation occurred after bearish broadening formation which is exactly opposite of the formation occurred before recent fall as shown in the chart. Interestingly, these are rare formations. But it cannot be the reason to expect similar kind of up move in the price. As discussed during last week, price is expected to hover around 7800. Trend remain down but trading setup is neutral.


Hourly Min Chart

Figure 2 is 10 box P&F chart plotted with hourly closing prices. Count and support level of 7710 discussed during prior write ups worked well and price bounced back from the same level. 7800 should work as support from here in short term as well. Hovering around that level is expected but bearish pattern below that can bring weakness and indicate that price may not be able to hold 7700. Supply zone on the higher side is at 7970 - 8010.

Figure 3 is X-Percent P&F Breadth indicator of Nifty 50. Indicator is at 42% hence at neutral zone. Setup on this indicator shown during last post  helped in identifying oversold zone and avoiding fresh shorts.

In brief

Trend is down but trade setup is neutral. Bearish pattern below 7800 would indicate that 7700 will not be held. 7970 - 8010 is resistance zone on the higher side.


- Prashant Shah, CMT, CFTe


Disclaimer:
All information provided above is for general information purposes only and does not constitute any investment advice. The readers of this material should take their own professional advice before acting on this information.


Sunday 15 November 2015

Nifty Point & Figure analysis

Nifty P&F Analysis!!
Date: 15th November 2015

Nifty last closing price: 7762.25
Daily chart

Figure 1 is 10 box P&F chart plotted with daily closing prices. Last formation is bearish 100% pole along with broadening formation as discussed in the last post. Pattern has seen follow through and activated lower count of 7290. Anchor point of the current setup is at 7800 where a halt or hovering is expected. Exit level for shorts is placed at 7830 now which will trigger double top buy formation.  


Hourly Min Chart

Figure 2 is 10 box P&F chart plotted with hourly closing prices. Down count of 7710 was discussed during last post. Trend is down but formation near this level should be monitored. 7930 - 7960 is a resistance zone.

Figure 3 is X-Percent P&F Breadth indicator of Nifty 50. Indicator is at 22% and approached oversold zone.

In brief

Trend is down and further lower counts are active. 7680 -7700 is reference zone on the lower side and  7930 - 7960 on the higher side.


- Prashant Shah, CMT, CFTe


Disclaimer:
All information provided above is for general information purposes only and does not constitute any investment advice. The readers of this material should take their own professional advice before acting on this information.


Sunday 8 November 2015

Nifty Point & Figure analysis

Nifty P&F Analysis!!
Date: 8th November 2015

Nifty last closing price: 7954.30

Daily chart

Figure 1 is 10 box P&F chart plotted with daily closing prices. Trend is down and pattern is bearish. It is 100% bearish pole meaning there is High pole and Bull trap in the same column. Last closing price is near support level of 7960 as discussed during last post. Price has seen important reversals around same level in the recent past when we look at left side of the chart. Short term bounce is possible if this level is held on closing basis. Bihar election news may result in gap down due to bearish sentiments. There is Anchor Point around 7800 which may act as support in that case. Though trend is down and any bearish formation would be an opportunity. Price above 8120 will form the Low Pole which is an exit level for shorts. Level will be trailed down further with new Os. 


Hourly Min Chart

Figure 2 is 10 box P&F chart plotted with hourly closing prices. 8130 worked well where price found resistance. Last price is near support level of 7960. Downside count of 7710 has got activated which is also a support level looking at previous bottoms. 7800 is Anchor point which can be seen on daily chart. Hence formations around these two levels should be monitored.  


Figure 3 is X-Percent P&F Breadth indicator of Nifty 50. Indicator is at 36% now which is a neutral zone.

In brief

Trend is down. 7800 and  7700 are reference levels on the lower side.        


- Prashant Shah, CMT, CFTe


Disclaimer:
All information provided above is for general information purposes only and does not constitute any investment advice. The readers of this material should take their own professional advice before acting on this information.

Sunday 1 November 2015

Nifty Point & Figure analysis

Nifty P&F Analysis!!
Date: 1st November 2015

Nifty last closing price: 8065.80

Daily chart

Figure 1 is 10 box P&F chart plotted with daily closing prices. High pole got formed when price went below 8205 which was the trigger to exit longs as discussed during last week. Retracement has exceeded 100% of previous swing move to form 100% pole. Price is trading below 45 degree trend line hence setup has become bearish but Double bottom sell signal would provide confirmation. Hence a bounce not going above 8180 (mid column value) would provide a trading opportunity to bears. Interestingly, current formation is bearish broadening formation followed after bullish broadening formation that indicates difficult phase for trend followers.


Hourly Min Chart

Figure 2 is 10 box P&F chart plotted with hourly closing prices. 8130 and 8190 are resistance levels if price witness bounce from here (Trend line & Anchor point). Previous bear trap can provide short term support around 7960 as shown in the chart. 7820 is cluster of support levels where one should look for bullish setup.

Figure 3 is X-Percent P&F Breadth indicator of Nifty 50. This indicator was major reason I wrote not to initiate fresh longs. I believe that breadth analysis is the vital tool in any kind of a trading kit. Indicator is at 38% now which is a neutral zone.

Figure 4 is 0.50% box P&F chart of Nifty plotted with closing prices. This chart was discussed during last post with reason for expecting a resistance. It has worked well.
   
In brief

Setup is turning bearish. Follow through will generate trading opportunity. 8130, 8190 on the higher side and 7960, 7820 on the lower side are key reference levels for the reasons mentioned above.


- Prashant Shah, CMT, CFTe


Disclaimer:
All information provided above is for general information purposes only and does not constitute any investment advice. The readers of this material should take their own professional advice before acting on this information.

Sunday 25 October 2015

Nifty Point & Figure Analysis!!

Date: 25th October 2015

Nifty last closing price: 8295.45
Daily chart

Figure 1 is 10 box P&F chart plotted with daily closing prices. Chart has not moved much during last week. Trend is up and formation is bullish but approaching a resistance zone placed near 8400. High pole will get formed at 8205 which is the exit level for longs.


Hourly Min Chart

Figure 2 is 10 box P&F chart plotted with hourly closing prices. Chart is bullish for short term & momentum traders. 8370, 8460 are active counts but at the same time they may act as a supply zone as well because of several formations that took place around same levels in the past. Price pattern will confirm the supply zone. 

Figure 3 is X-Percent P&F Breadth indicator of Nifty 50. 70% stocks from Nifty 50 are bullish.

Figure 4 is 0.50% box P&F chart of Nifty plotted with closing prices. It shows the current broader picture of Nifty. Price witnessed sharp sell off after Quadruple bottom formation below 8357 during August 2015. Price is approaching breakout level of that formation which is expected to act as a resistance though temporary.  
   
In brief

Charts remain bullish. But approaching resistance zone. Price pattern will confirm the supply and whether it remains temporary or lock an intermediate top. Exit level for current longs is 8205. Fresh longs should wait for the opportunity. 


- Prashant Shah, CMT, CFTe


Disclaimer:
All information provided above is for general information purposes only and does not constitute any investment advice. The readers of this material should take their own professional advice before acting on this information.