Horizontal columns. Let them decide direction!!
Date: 14th Sept
2014
Nifty last closing price: 8105.50
Daily chart
Figure 1 is 10 box value chart plotted
with daily closing prices. Column has finally turned to ‘O’ after recording 60
boxes of ‘X’. Price is trading above bullish line and Trend remains up. Setup
is bullish unless price closes below 7875.
Hourly Chart
Figure 2 is 10 box value chart
plotted with hourly high-low prices. The setup is horizontal at the moment, meaning
no decisive trend. ‘X’ is still dominating in the right part of the chart but
High pole formation is followed by double bottom sell signal that indicates
some weakness. Price has taken support at bottom of previous column of ‘O’.
8050 – 8040 seems immediate support and more downside counts will get activated
if that level is breached. 8060 will become mini bottom if price trades above
8130.
1 Min Chart
Figure 3 is 5 box value chart plotted with closing prices of every minute. Horizontal
trend can very well be seen on this chart. 8040 – 60 shown by yellow box in the
chart is immediate support zone. Anchor point of the pattern is at 8090 level
and setup around that would be interesting.
Horizontal trend or Fulcrum
pattern gives opportunity to analyse the structure in 1 box chart. Figure 4 is
1 min chart of 5 box value plotted with 1 box reversal. Within larger Fulcrum, there are smaller
Fulcrum patterns shown in the chart by plotting horizontal counts from them.
Breakout from these small patterns can provide short term trading
opportunities. Breakout awaited from current pattern hence counts in both the direction
are shown. Anchor Point hence base of the larger Fulcrum is at 8090 levels. The
same kind of Fulcrum setup was developed at 7900 – 7950 levels between 19th
to 27th August which was followed by upside breakout as shown in
Figure 5.
As expected & wrote
during last week, price is consolidating and short term trend has become
horizontal. Let breakout happen. 8050 – 8040 is immediate support zone and 7940 – 7960 is next level
to be seen. Larger trend remains bullish with higher active counts. And formation
of ‘X’ on daily chart remains interesting unless price goes below 7875.
 |
| Figure 1: Nifty daily 10 x 3 CL Point and Figure Chart |
 |
| Figure 2: Nifty 60 min 10 x 3 HL Point and Figure Chart |
 |
| Figure 3: Nifty 1 min 5 x 3 cl Point and Figure Chart |
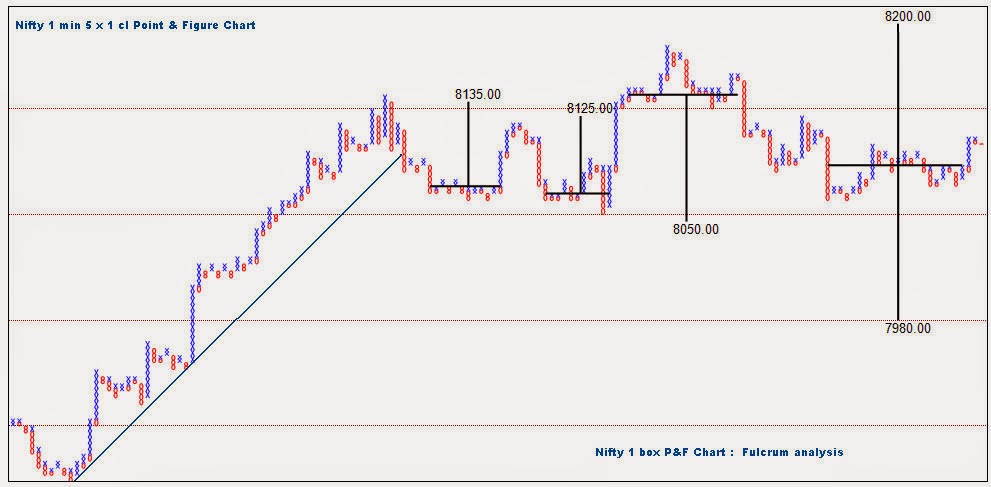 |
| Figure 4: Nifty 1 min 5 x 1 cl Point and Figure Chart |
 |
| Figure 5: Nifty 1 min 5 x 1 cl Point and Figure Chart |
- Prashant Shah, CMT, CFTe
Disclaimer:
All information provided above is for general information purposes only and does not constitute any investment advice. Company or Author shall not be liable for loss or damage that may arise from use of information provided above. The report is purely for information purposes and does not construe to be investment recommendation/advice or an offer or solicitation of an offer to buy/sell any securities. The readers of this material should take their own professional advice before acting on this information.
All information provided above is for general information purposes only and does not constitute any investment advice. Company or Author shall not be liable for loss or damage that may arise from use of information provided above. The report is purely for information purposes and does not construe to be investment recommendation/advice or an offer or solicitation of an offer to buy/sell any securities. The readers of this material should take their own professional advice before acting on this information.


