Nifty
P&F Analysis!!
Date: 8th November 2015
Nifty last closing price: 7954.30
Daily chart
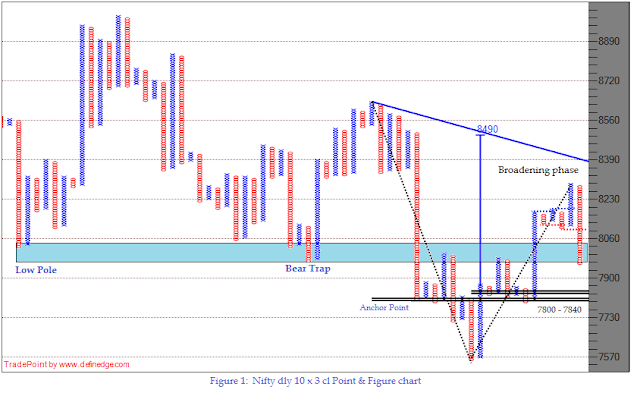
Figure 1 is 10
box P&F chart plotted with daily closing prices. Trend is down and
pattern is bearish. It is 100% bearish pole meaning there is High pole and Bull
trap in the same column. Last closing price is near support level of 7960 as
discussed during last post. Price has seen important reversals around same
level in the recent past when we look at left side of the chart. Short term bounce is possible if this level is held on closing basis. Bihar election news may
result in gap down due to bearish sentiments. There is Anchor Point around 7800
which may act as support in that case. Though trend is down and any bearish
formation would be an opportunity. Price above 8120 will form the Low Pole
which is an exit level for shorts. Level will be trailed down further with new
Os.
Hourly Min Chart
Figure 2 is 10
box P&F chart plotted with hourly closing prices. 8130 worked well where price
found resistance. Last price is near support level of 7960. Downside count of
7710 has got activated which is also a support level looking at previous
bottoms. 7800 is Anchor point which can be seen on daily chart. Hence
formations around these two levels should be monitored.
Figure 3 is X-Percent
P&F Breadth indicator of Nifty 50. Indicator is at 36% now which is a
neutral zone.
In brief
Trend is down. 7800
and 7700 are reference levels on the
lower side.
- Prashant Shah, CMT, CFTe
Disclaimer:
All information provided above is for general information purposes only and does not constitute any investment advice. The readers of this material should take their own professional advice before acting on this information.
All information provided above is for general information purposes only and does not constitute any investment advice. The readers of this material should take their own professional advice before acting on this information.


Your analysis report is very helpful for new inverters. You can read more report on Epic Research Blog.
ReplyDelete